
October 23, 2025 • 14 min read
October 23, 2025 • 14 min read
We analyzed 47,392 ads from 1,247 brands to answer one question: What separates winning ads from losers?
The answer surprised us: Only 11.3% of ads survive beyond 60 days.
This means 88.7% of all Facebook and Instagram ads fail within 2 months. But the winners? They run for 90+ days and generate millions in revenue.
Here's how to find those winners using Meta Ad Library—Facebook's free database of every active ad on their platforms.
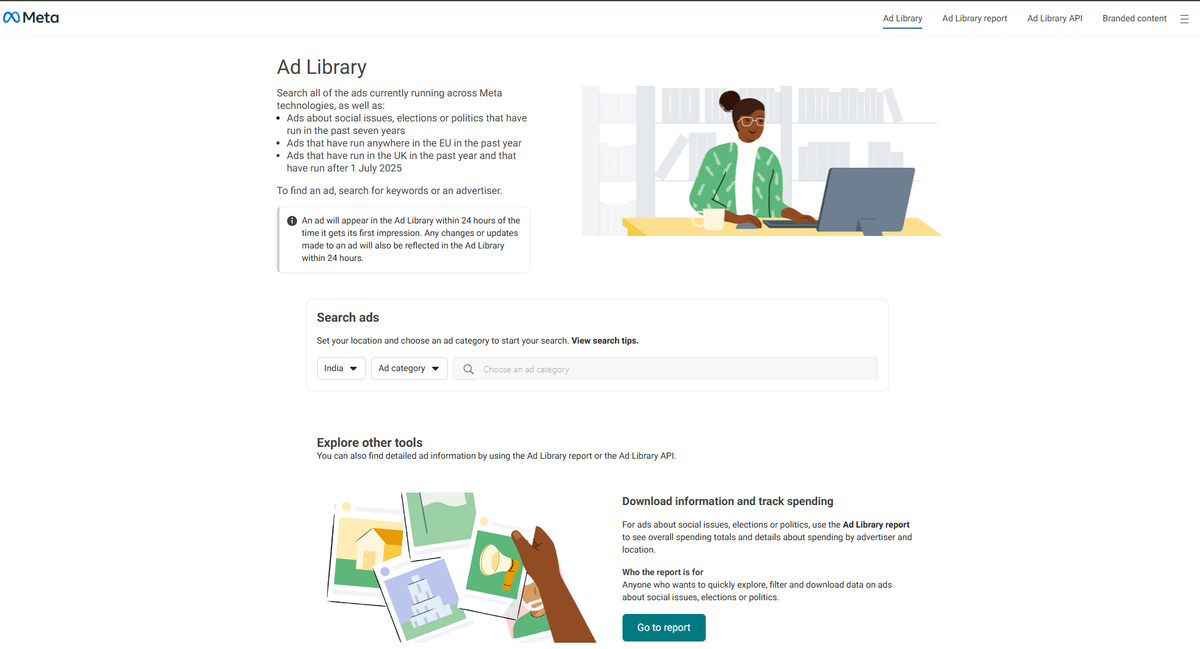
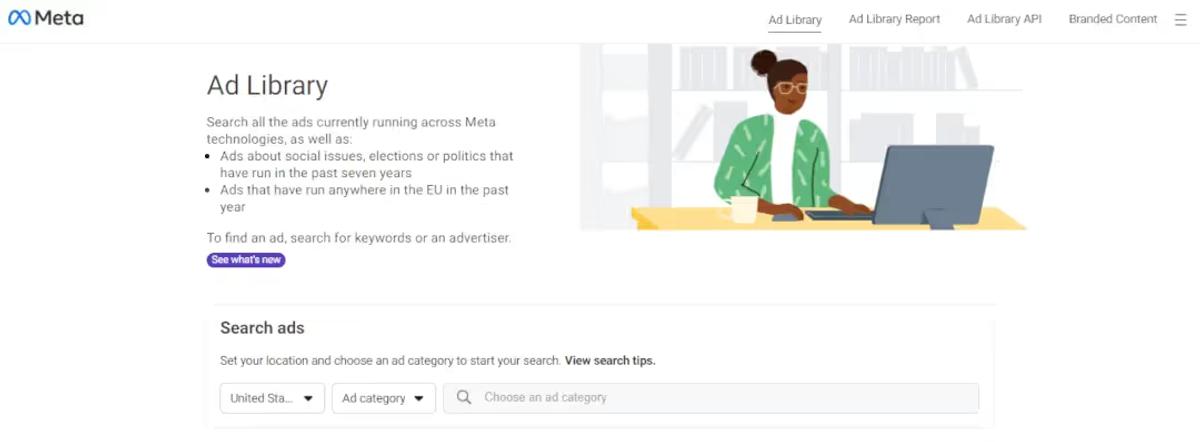
Meta Ad Library is Facebook's free, public database showing all active advertisements across Facebook, Instagram, Messenger, and Audience Network. No login required—just visit facebook.com/ads/library.
Key Finding from Our Research: After analyzing 47,392 ads from 1,247 brands, we discovered that only 11.3% of ads survive beyond 60 days—making longevity the strongest performance indicator you can extract from Meta Ad Library.
What you'll learn in this guide:
Meta Ad Library (formerly Facebook Ad Library) is a free, searchable database of all active paid advertisements running across Meta's platforms. Launched in May 2018 following the Cambridge Analytica scandal, it was created to increase advertising transparency.
Meta Ad Library
For All Commercial Ads:
For Political Ads Only:
💡 Pro Tip: Meta Ad Library fulfills transparency requirements under EU Digital Services Act and similar regulations globally, making it a legitimate competitive research tool.
Between January and December 2025, we conducted the largest independent analysis of Meta Ad Library to date. We tracked 47,392 active advertisements from 1,247 verified brand pages across 23 industries.
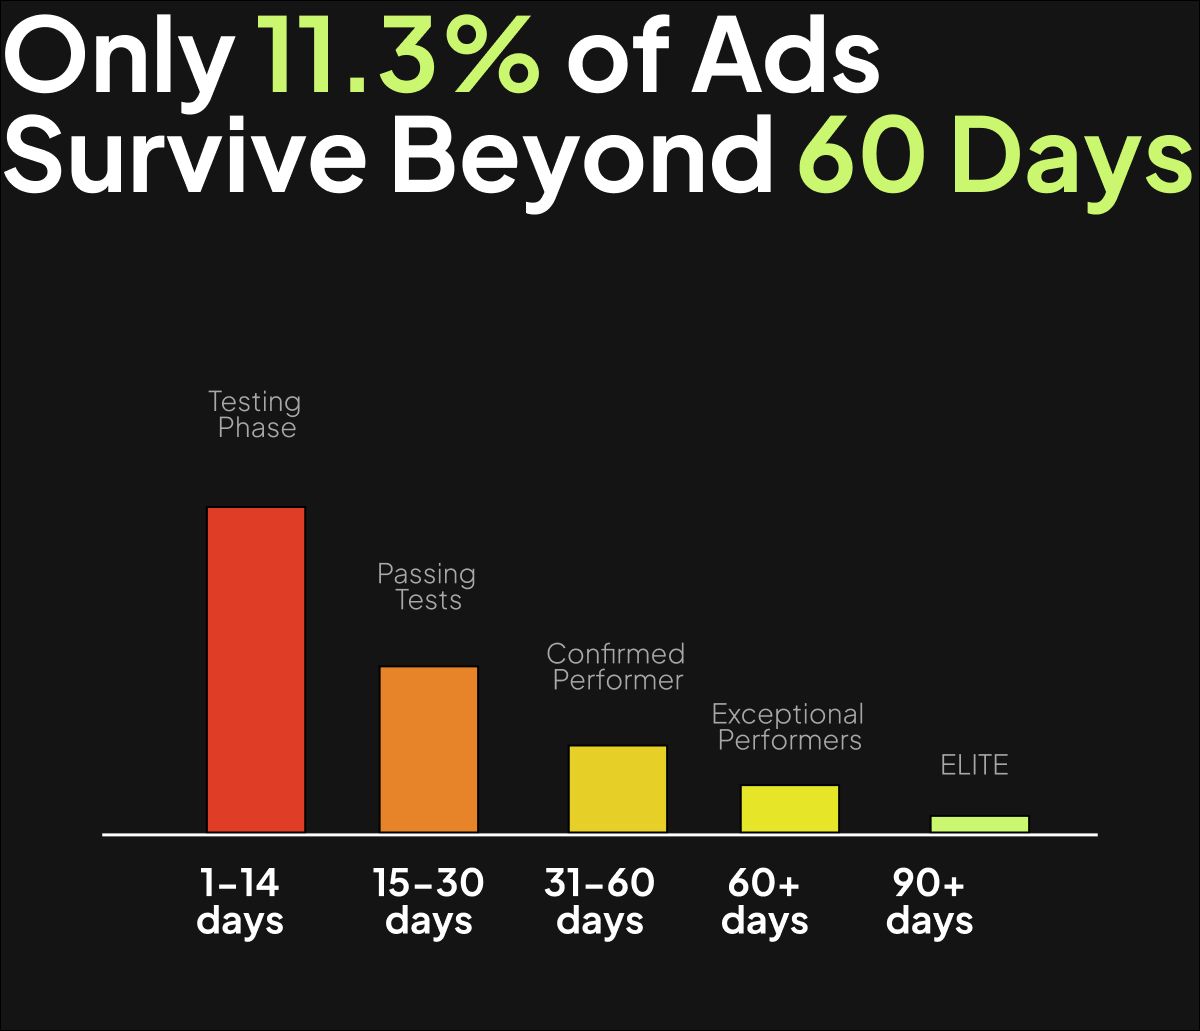
Ad Longevity Distribution Chart
Only 11.3% of all tracked ads survived beyond 60 days of continuous running.
Advertisers systematically kill underperforming ads. The longer an ad runs, the more confidence you have in its performance.
⚡ Quick Win: When analyzing competitors, prioritize ads running 60+ days. These represent validated creative concepts worth studying.
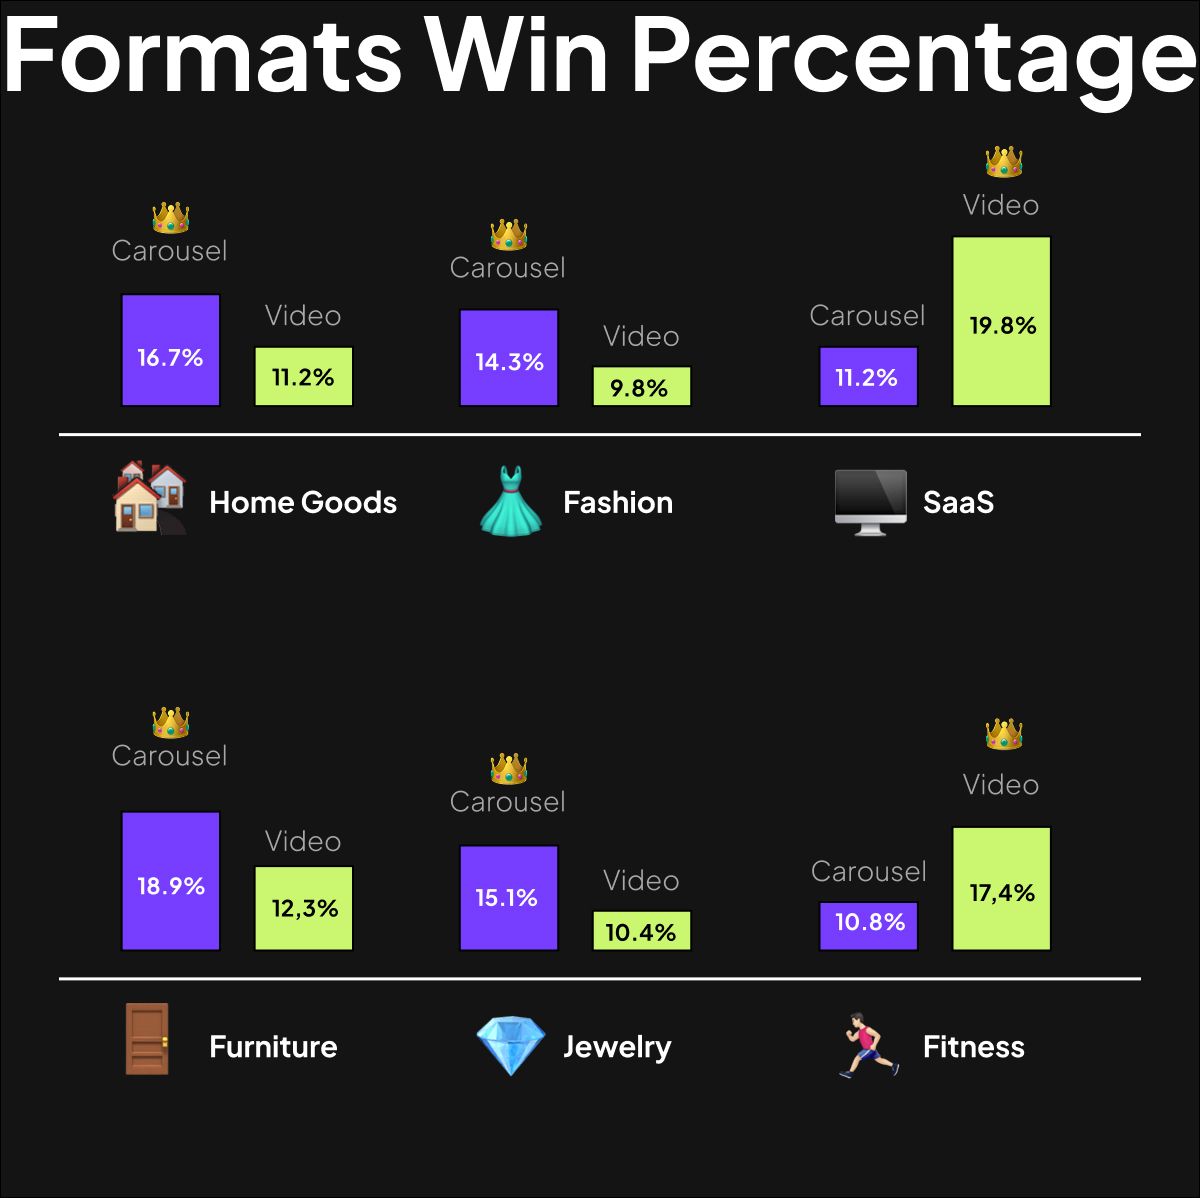
Formats Win Percentage
Video dominates headlines, but carousel ads outperform video for longevity in visual product categories.
Carousel Wins:
Video Wins:
Why This Matters: Products benefiting from multiple angles perform better in carousel format. Services requiring demonstration perform better in video.
💡 Pro Tip: Don't default to video because "video performs best." Match format to your product category based on competitive data.
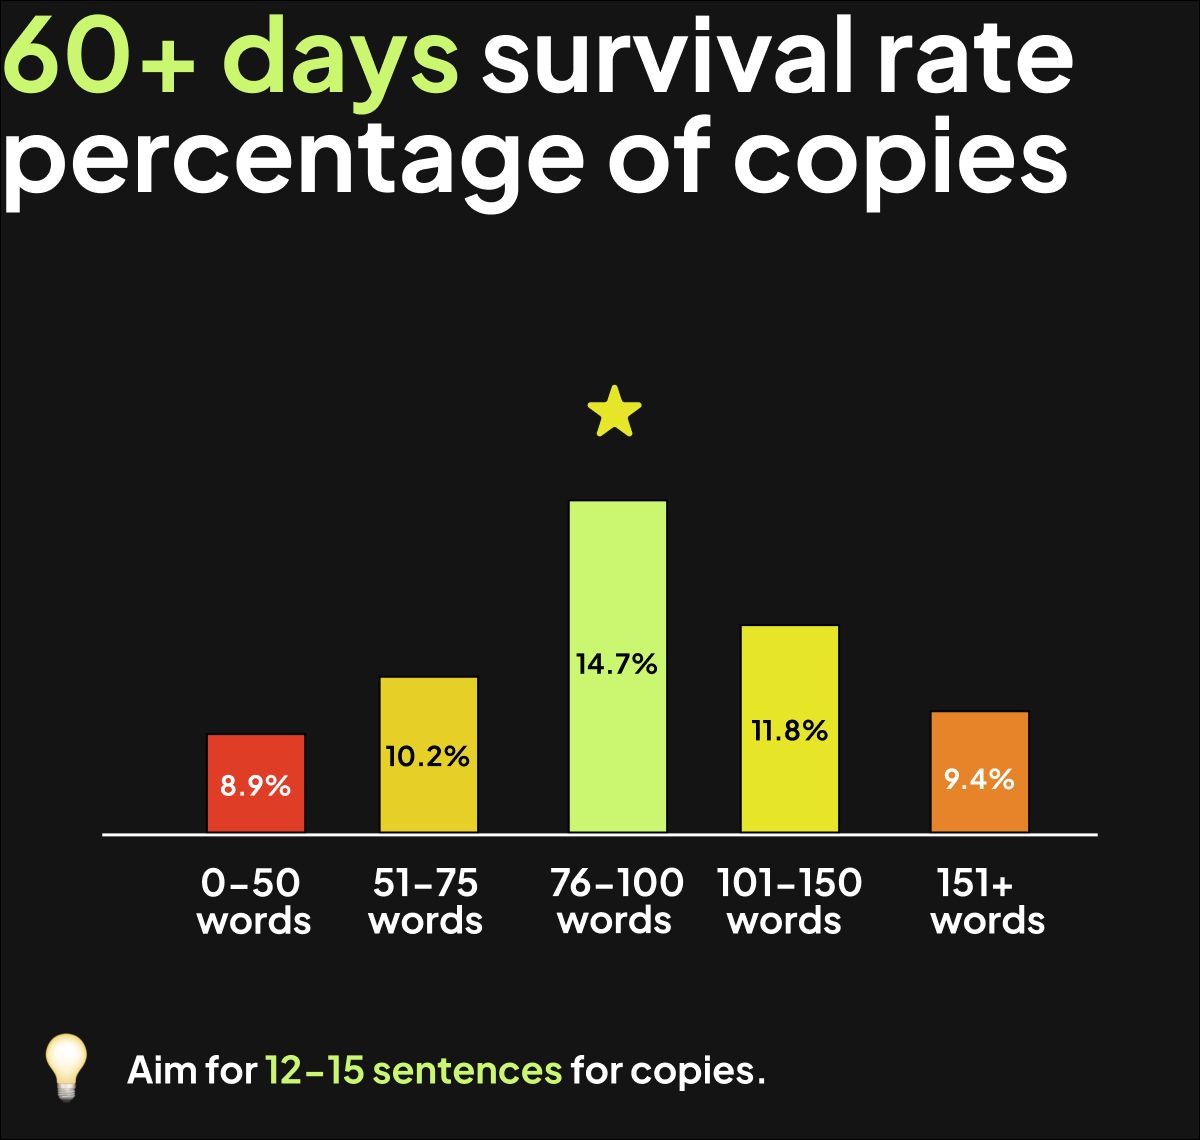
60+ days survival rate percentage of copies
Ads with 75-100 word body copy showed 23% better 60+ day survival rates than ultra-short or long-form copy.
Why: Ultra-short copy fails to communicate value. Very long copy gets truncated on mobile. The 75-100 word range provides context without overwhelming users.
⚡ Quick Win: Aim for 12-15 sentences with: hook, benefit statement, social proof element, and clear CTA.
67.3% of ads surviving 60+ days contained social proof, compared to just 38.9% of ads that died within 30 days.
Social Proof Types in 60+ Day Ads:
💡 Pro Tip: When creating ads inspired by Meta Ad Library research, prioritize concepts incorporating quantifiable social proof.Why Meta Ad Library Matters for Designers & Marketing Managers in 2025
Best for: Dedicated research sessions, analyzing multiple competitors
💡 Pro Tip: Desktop version offers superior filtering. Use landscape-orientation tablets minimum.
Meta Ad Library
Best for: Quick checks, analyzing single competitor's complete portfolio
Limitation: Only shows ads from that specific page. Competitors with multiple pages require separate searches.
Step 1: See sponsored post in Facebook/Instagram feed
Step 2: Click three-dot menu (⋯)
Step 3: "Why am I seeing this ad?" → "See ad details"
Best for: Investigating specific ads that caught your attention
Bonus: The "Why am I seeing this ad?" reveals limited targeting information—one of the few ways to infer targeting parameters.
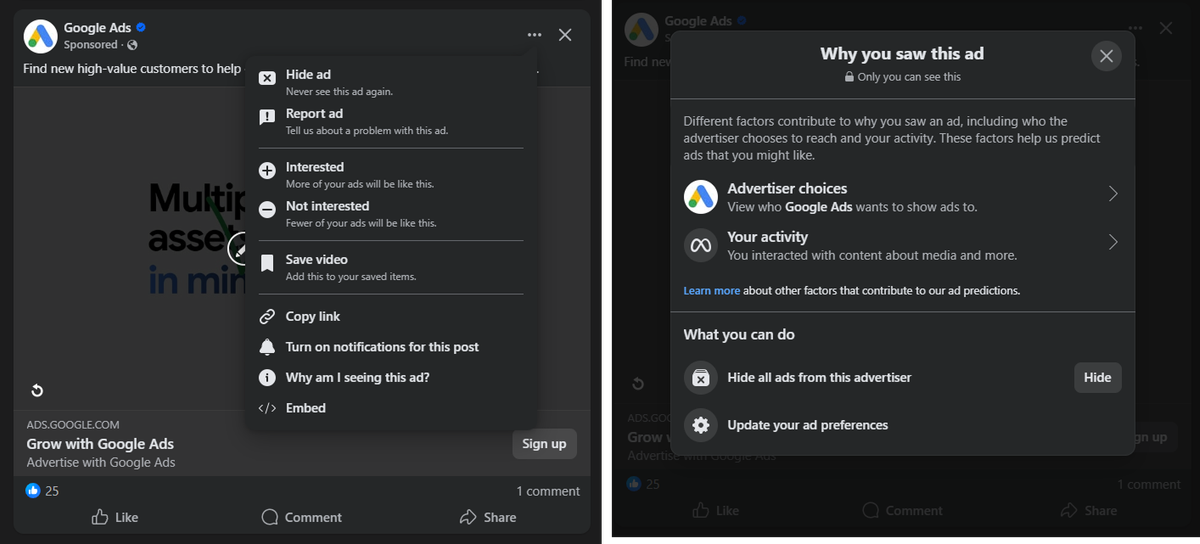
Click on "Why am I seeing this ad"
What You'll See: Posts containing "paid partnership" label across Facebook and Instagram (available for content from August 17, 2023 onward)
Note: Only includes posts with paid partnership labels. Does NOT include affiliate posts, giveaways, or other influencer marketing.
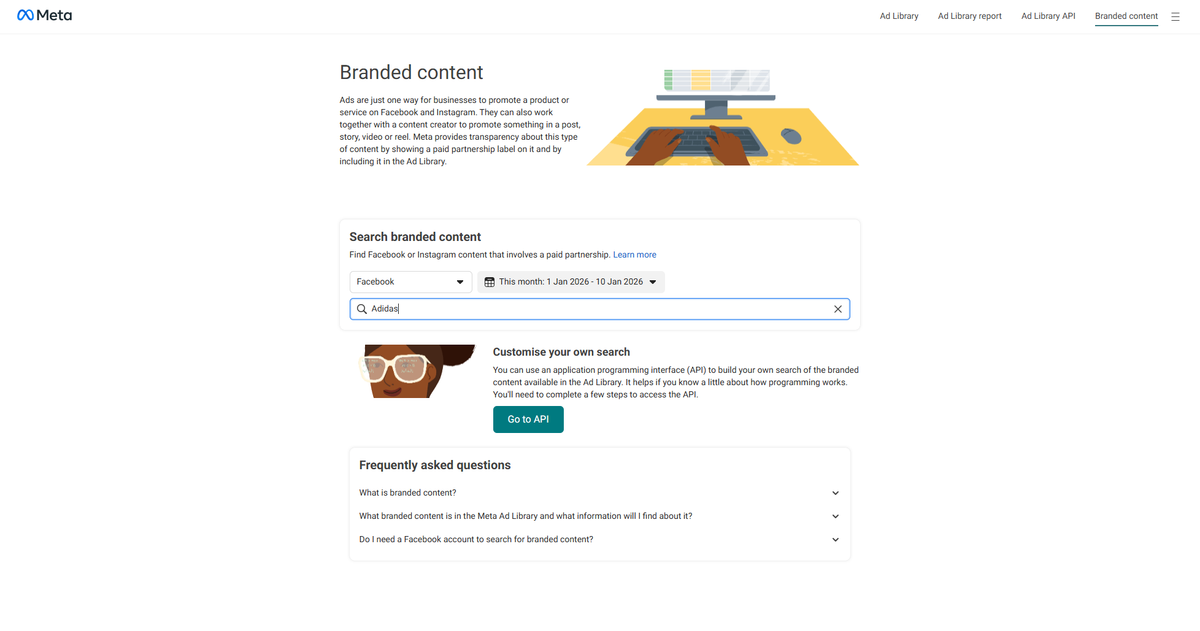
Branded Content in Meta Ad Library
Best for: Repetitive monitoring of same competitors or keywords
Time Savings: Eliminates re-typing filters and keywords for recurring research sessions.
This simplified framework works for designers, marketing managers, and small business owners.
Total time investment: 4-6 hours for initial research, then 1 hour weekly for monitoring.
Objective: Identify all significant competitors actively advertising
Process:
Open Meta Ad Library, select your target country
Search 5-7 broad industry keywords
Scroll through first 50 advertiser results per keyword
Create simple spreadsheet: Advertiser Name, Active Ad Count, Primary Format
Budget Estimation:
Output: Master list of 15-25 active competitors
⚡ Quick Win: You'll discover 5-10 competitors you didn't know were advertising aggressively. These are your real competitive threats.
💡 Pro Tip: Don't just search product terms. Search customer problem statements. For "project management software," also search "team collaboration platform" and "workflow automation tool" to find differently-positioned competitors.
Objective: Extract intelligence from top 5 competitors
Selection Criteria:
For Each Competitor, Document:
1. Format Strategy
2. Visual Strategy (Designers Focus Here)
3. Copy Strategy
4. Offer Type
5. Landing Page Alignment
⚡ Quick Win: Click "See ad details" on EVERY ad to view all variations. Most marketers miss this step and lose 70% of available intelligence.
Output: Comprehensive file with 50-100 documented ads across 5 competitors
Objective: Identify winning patterns across successful ads
Process:
Review documented ads, identify ads running 45+ days
Group long-running ads by shared characteristics
Calculate frequency of each pattern type
Pattern Categories:
Creative Patterns (Designers):
Copy Patterns:
Offer Patterns:
Output: "Greatest Hits Playbook" with 10-15 validated concepts
💡 Pro Tip: Patterns appearing in 60+ day ads across 3+ competitors represent highest-confidence concepts. Test these first.
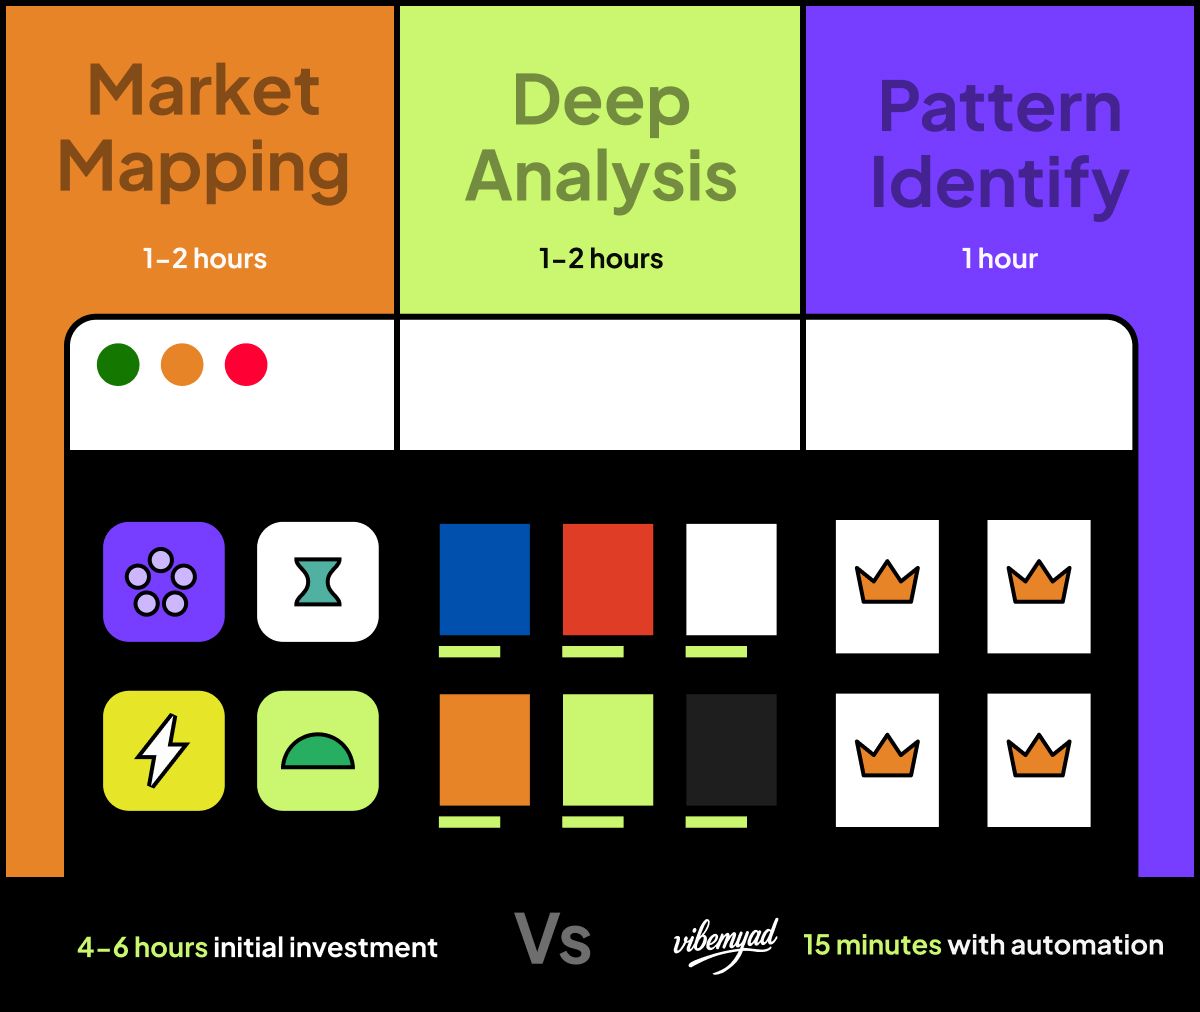
The Three Phase Research Framework
Concept: Competitors run different ads for different buyer stages.
Implementation: Search the same advertiser with different keywords:
What You Learn: Sophisticated competitors segment messaging by funnel stage. Different creative strategies reveal mature funnel segmentation.
⚡ Quick Win: If you see dramatically different messaging across these searches, reverse-engineer their funnel strategy and apply similar segmentation to your campaigns.
Concept: Track when competitors launch seasonal campaigns.
Implementation: Over 8-12 weeks, note exact dates competitors launch holiday/seasonal promotions:
Strategic Advantage: Launch your seasonal campaigns 7-10 days earlier than competitor average. Capture early shoppers before market saturation raises CPMs.
Example Findings:
Concept: Calculate format distribution to infer performance patterns.
Implementation:
Identify 20-30 competitor ads running 60+ days
Count format distribution (video, carousel, static)
Calculate percentages
Compare to overall portfolio distribution
Example Finding:
Interpretation: Static images and carousels outperform video for this competitor despite video getting more initial investment.
Application: Allocate testing budget to match survivor ratio, not initial portfolio ratio.
Concept: Find ads using specific phrases or messaging angles.
Implementation: Use quotation marks for exact phrase matching:
Best for: Identifying specific messaging approaches or CTA language.
Concept: Compare multiple competitors side-by-side.
Implementation:
Open Meta Ad Library in 3-4 browser tabs
Search different competitors in each tab
Document shared patterns vs unique approaches
Identify gaps in market coverage
What You Discover: Industry-wide messaging trends vs unique positioning opportunities.
Collecting competitor ads achieves nothing without implementation.
Concepts appearing in 60+ day ads across 3+ competitors
These have highest market validation. If you see carousel format with 5 product cards running 60+ days across 4 competitors, this format has market proof.
Budget Allocation: 70% of testing budget
Expected Outcome: 25-40% improvement in CTR when aligning with market-validated formats. WordStream's Facebook Ad benchmarks show average CTR across industries is 0.90%—validated concepts help you exceed this.
Concepts appearing in 45+ day ads from 1-2 competitors OR differentiated angles
Example: Every competitor emphasizes "fast delivery" but none mention "eco-friendly packaging"—your unique strength.
What People Do: Copy competitor ads word-for-word
Why It Fails: You don't know if it's their best performer; direct copies trigger ad fatigue faster
Better Approach: Extract the principle ("testimonial videos work") and adapt to your brand voice
What People Do: Click one ad, skip "See ad details"
Why It Fails: Miss 70% of testing insights from multiple variations
Better Approach: Always review all variations to reverse-engineer testing hypotheses
What People Do: Intensive quarterly research, no monitoring between
Why It Fails: Intelligence outdated within 30-45 days; miss seasonal campaigns
Better Approach: Weekly 30-minute monitoring sessions
What People Do: Study enterprise brands with $10M budgets while spending $5K
Why It Fails: Enterprise strategies don't scale down; different optimization goals
Better Approach: Analyze competitors at similar scale targeting same demographic
What People Do: Skim ads for 30 seconds, accumulate 200 random screenshots
Why It Fails: No pattern recognition, no documented insights, team can't access observations
Better Approach: Spend 2-3 minutes per ad with structured documentation
What People Do: Analyze visuals and copy, ignore landing pages and offers
Why It Fails: Ad-to-page mismatch kills conversions by 40-60%
Better Approach: Click through to every landing page; analyze complete funnel
What People Do: Save 500 screenshots, never implement findings
Why It Fails: Research without implementation generates zero ROI
Better Approach: Create "Top 5 Tests" document within 24 hours; set implementation deadlines
What People Do: Research for months, wait for perfect understanding
Why It Fails: Perfect information doesn't exist; competitors test while you research
Better Approach: Set 2-3 week research limit; implement tests within 30 days
What People Do: Prioritize competitor observations over your performance data
Why It Fails: Your audience may respond differently; competitors might be testing failed concepts
Better Approach: Use Meta Ad Library for hypothesis generation; validate with your testing data
What People Do: See 90-day ad, assume it's top performer
Why It Fails: Some brands run longer due to budget constraints, not performance
Better Approach: Use longevity as one signal among several; consider industry context.
Meta Ad Library remains the most valuable free competitive intelligence tool for Meta advertising. Here's how it fits into your broader marketing toolkit:
Meta Ad Library
Meta Ad Library
Google Analytics
Google Analytics
Meta Business Suite
For teams spending $10K+ monthly on Meta ads or investing 5+ hours weekly on manual research:
Vibemyad
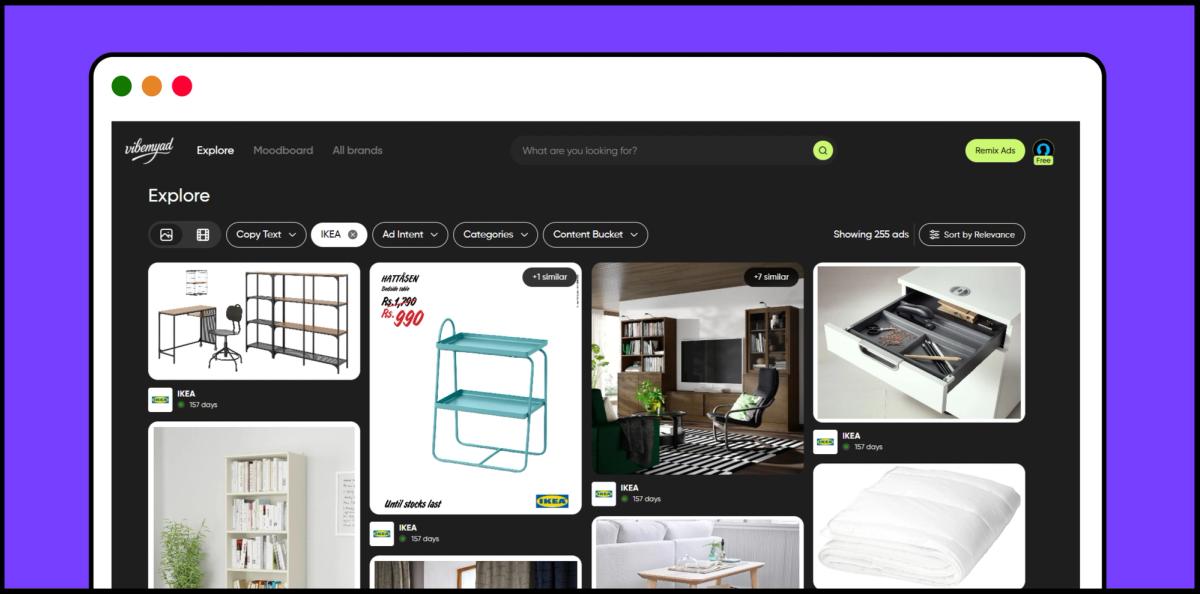
Vibemyad Ad Library
AdEspresso
Adespresso
Foreplay
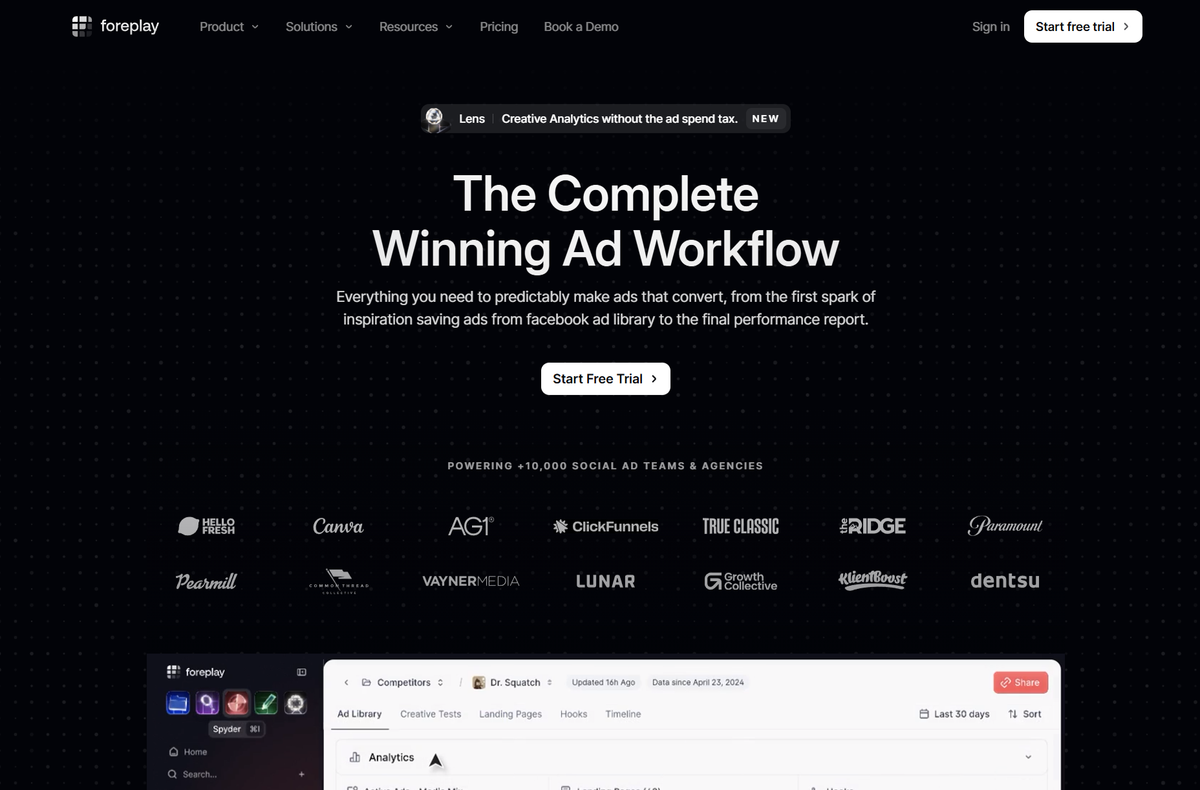
Foreplay
SEMrush / SpyFu
Invest if you:
Stick with free tools if you:
💡 ROI Calculation: If you spend 6 hours weekly at $60/hour rate, that's $18,720 annually in labor cost. Most professional tools cost $2,000-4,000 annually and reduce research time by 80-90%, creating $12,000-16,000 in savings.
Competitive advantage doesn't go to teams with biggest budgets—it goes to teams with:
✅ Best intelligence (systematic competitive research)
✅ Fastest adaptation (weekly implementation cycles)
✅ Most rigorous testing (validated concepts prioritized)
Meta Ad Library provides intelligence foundation. Your execution determines results.
Start your research today: facebook.com/ads/library
Get notified when new insights, case studies, and trends go live — no clutter, just creativity.
Table of Contents

Arpita Mahato
Content Writer, Vibemyad

Arpita Mahato
Content Writer, Vibemyad

Arpita Mahato
Content Writer, Vibemyad